监控-Prometheus
[TOC]
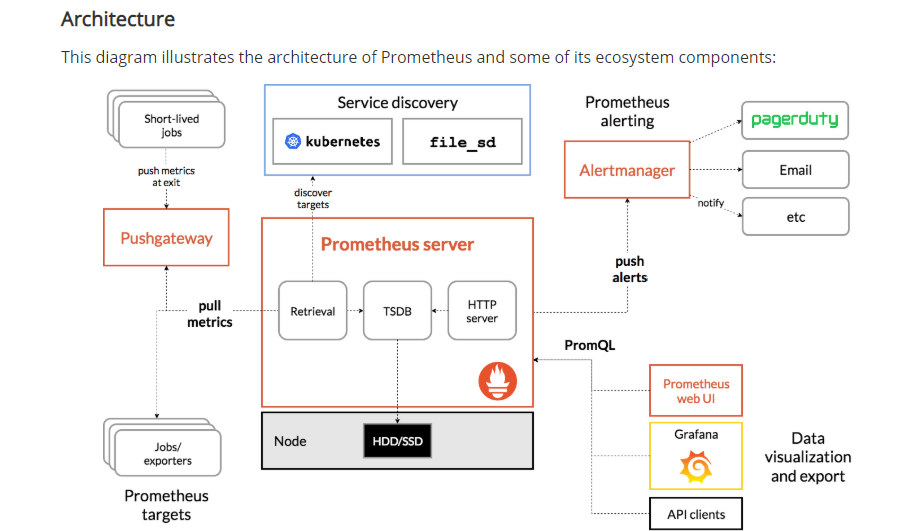
Prometheus,是由
go语言所开发的开源的监控与报警平台,数据存储在时间序列数据库TSDB中,适合监控容器平台时间序列数据(TimeSeries Data):按照时间顺序记录系统、设备状态变化的数据被称为时序数据
一、Prometheus
1.服务端安装
下载地址: https://prometheus.io/download/
安装
tar -xf prometheus-2.5.0.linux-amd64.tar.gz
mv prometheus-2.5.0.linux-amd64 /usr/local/prometheus
启动:
/usr/local/prometheus/prometheus --config.file="/usr/local/prometheus/prometheus.yml" &
lsof -i:9090
访问: http://IP:9090/
2.监控远程主机
第一步:安装
下载node_exporter,下载地址: https://prometheus.io/download/
tar -xf node_exporter-0.16.0.linux-amd64.tar.gz
mv node_exporter-0.16.0.linux-amd64 /usr/local/node_exporter
第二步:启动
nohup /usr/local/node_exporter/node_exporter &
lsof -i:9100
测试: http://IP:9100/metrics
第三步:prometheus服务器添加被监控机
# vim /usr/local/prometheus/prometheus.yml

 #添加如下内容
  - job_name: 'target1'
    static_configs:
    - targets: ['10.1.1.73:9100']
第四步:重启服务
pkill prometheus
/usr/local/prometheus/prometheus --config.file="/usr/local/prometheus/prometheus.yml" &
第五步:验证
①在web端的Status-->>Targets中查看机器连接状态
②查看CPU负载
node_load153.监控远程mysql
第一步:安装
下载mysqld_exporter,下载地址: https://prometheus.io/download/
tar -xf  mysqld_exporter-0.11.0.linux-amd64.tar.gz
mv mysqld_exporter-0.11.0.linux-amd64 /usr/local/mysqld_exporter第二步:创建mysql用户
grant select,replication client,process ON *.* to 'mysql_monitor'@'localhost' identified by '123';
flush privileges;
添加配置文件,指定客户端连接信息
# vim /usr/local/mysqld_exporter/.my.cnf

[client]
user=mysql_monitor
password=123
第三步:启动
nohup /usr/local/mysqld_exporter/mysqld_exporter --config.my-cnf=/usr/local/mysqld_exporter/.my.cnf &
lsof -i:9104
测试: http://IP:9100/metrics
第三步:prometheus服务器添加被监控机
# vim /usr/local/prometheus/prometheus.yml

#添加如下内容
  - job_name: 'mysql'
    static_configs:
    - targets: ['10.1.1.73:9104']
第四步:重启服务
pkill prometheus
/usr/local/prometheus/prometheus --config.file="/usr/local/prometheus/prometheus.yml" &
第五步:验证
①在web端的Status-->>Targets中查看机器连接状态
②查看mysql连接数
mysql_global_status_threads_connected
二、Grafana
数据分析展示平台,开源免费
1.安装
下载软件: https://grafana.com/grafana/download
下载rpm包
yum install grafana-6.4.2-1.x86_64.rpm
启动服务
systemctl start grafana-server
systemctl enable grafana-server
lsof -i:3000
访问: http://IP:3000/login
默认账号密码为admin
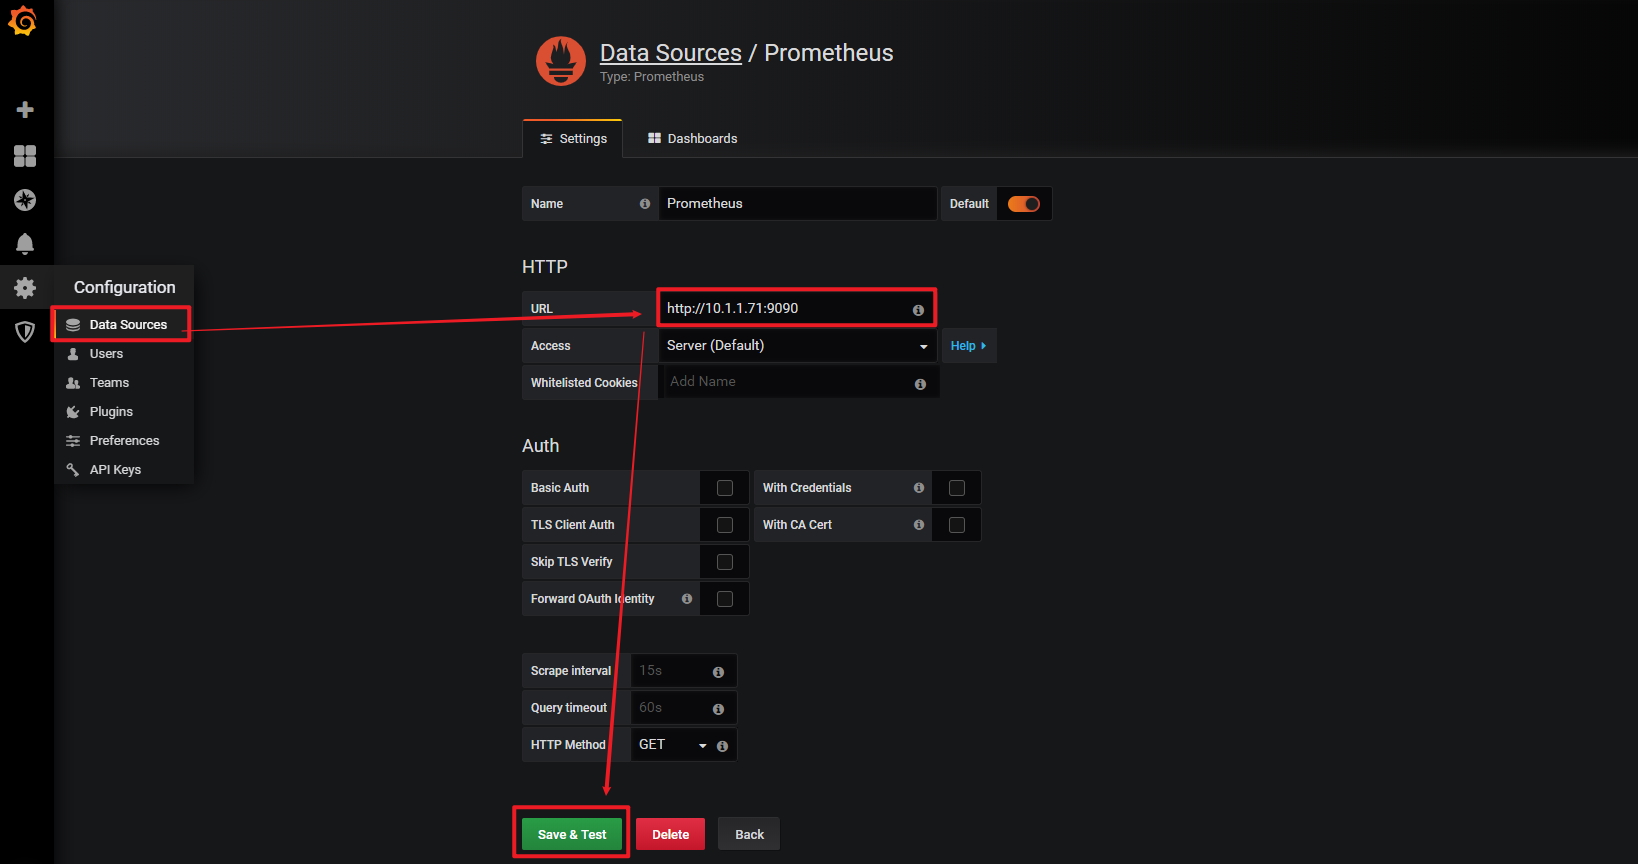
2.添加Prometheus数据源
3.创建DashBoard
第一步:新建

第二步:添加查询语句

第三步:设置图形样式
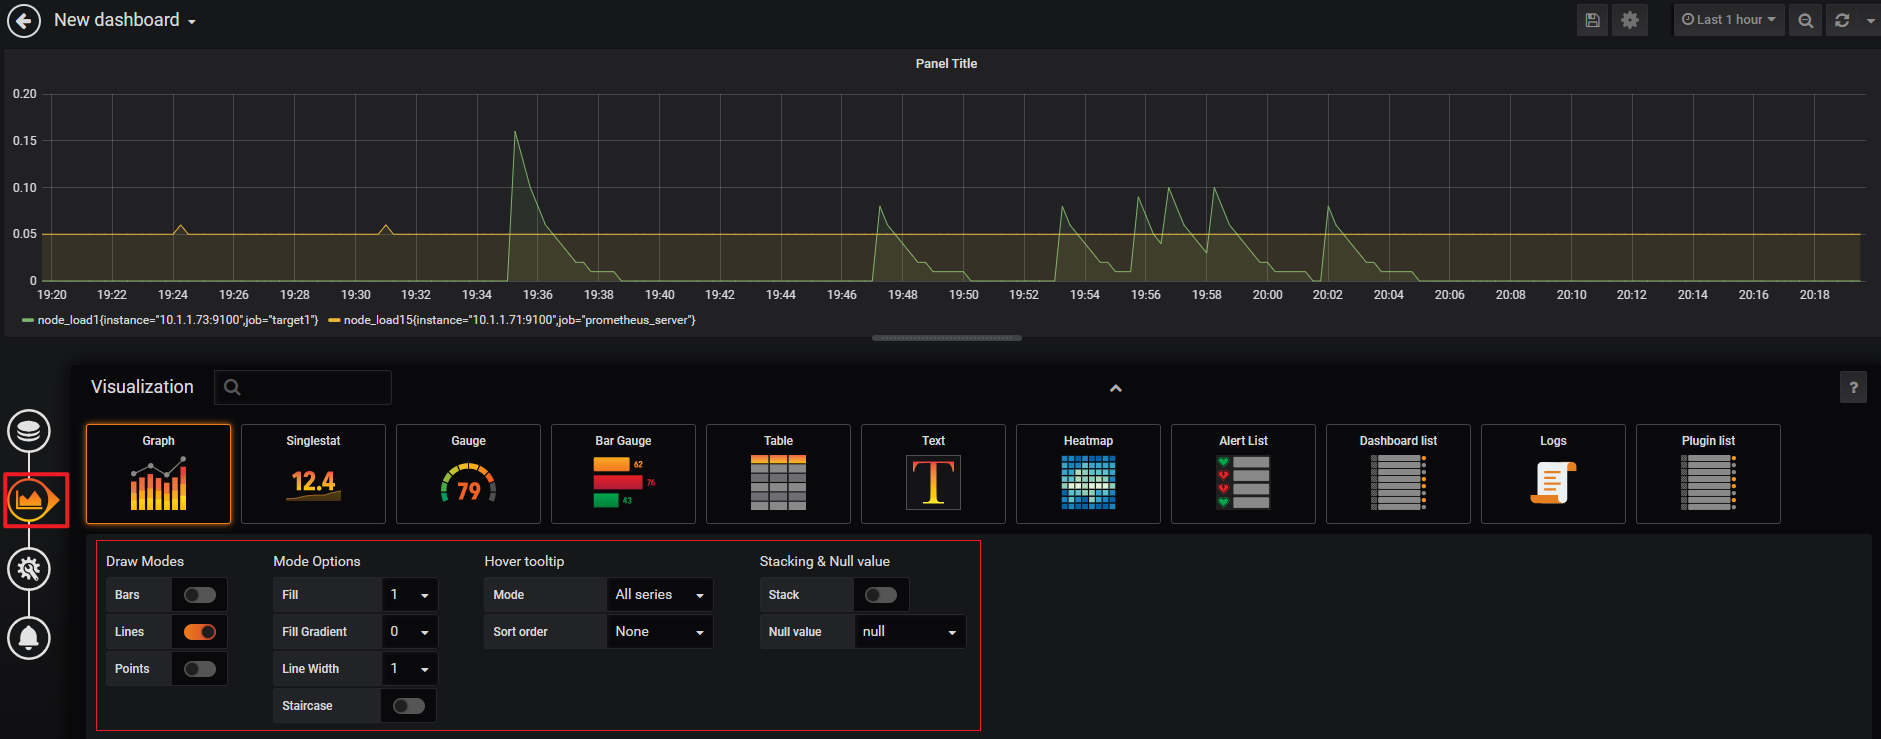
第四步:保存
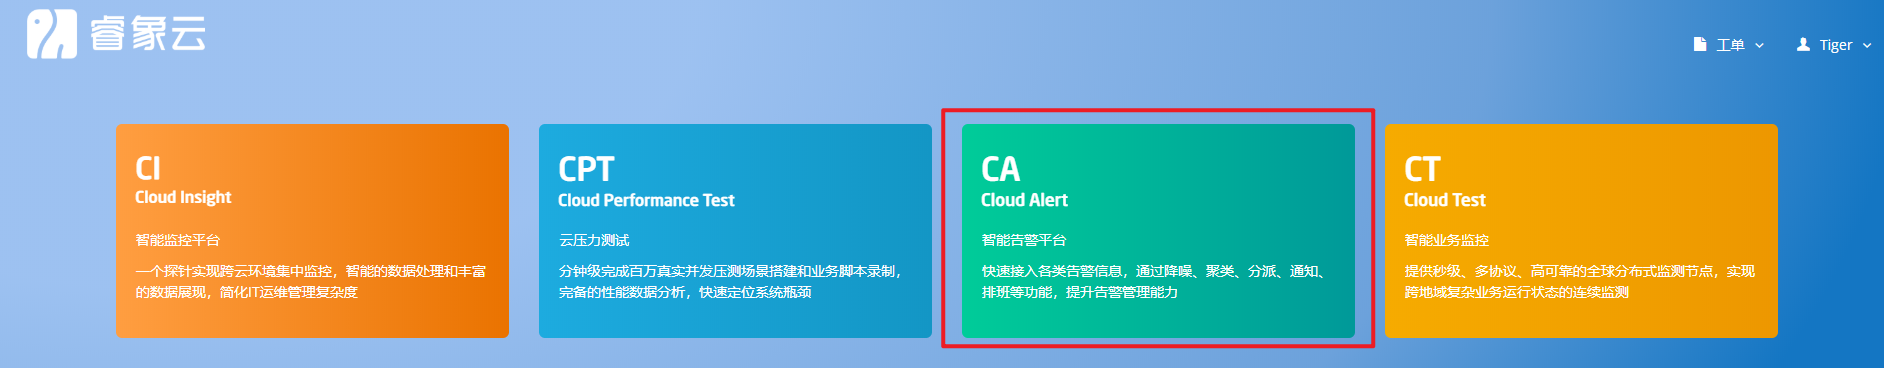
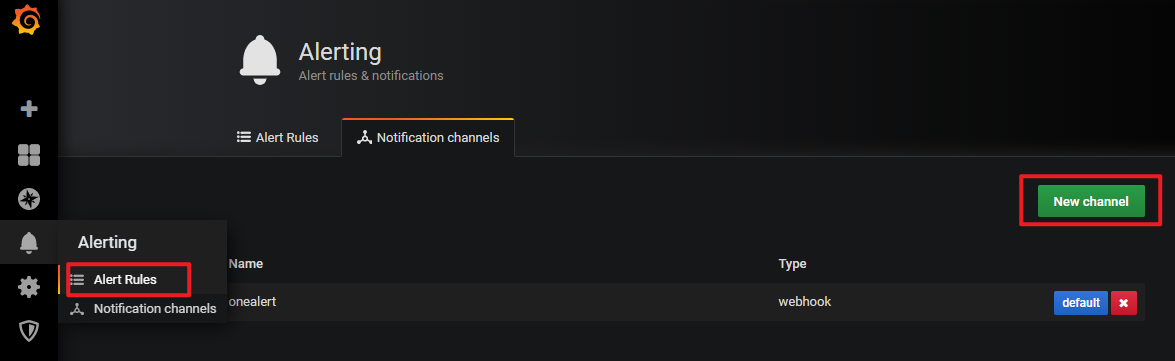
4.接入报警平台
接入第三方报警平台 CloudAlert http://onealert.com/
第一步:添加Grofana监控

第二步:添加通知策略
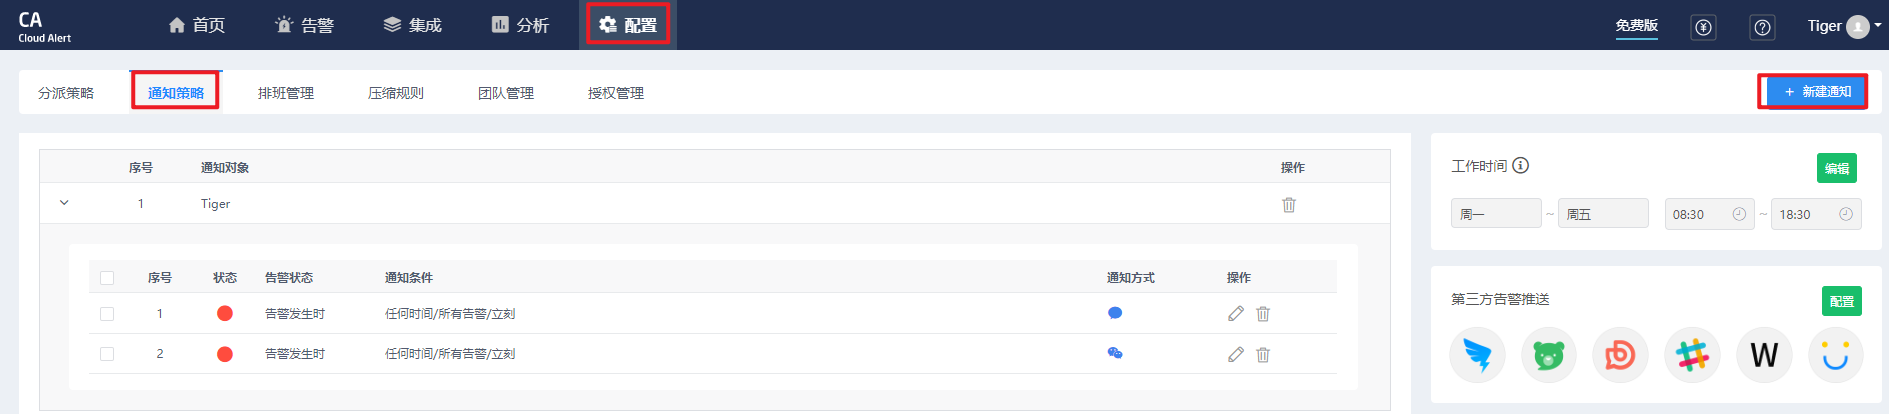
第三步:生成Key

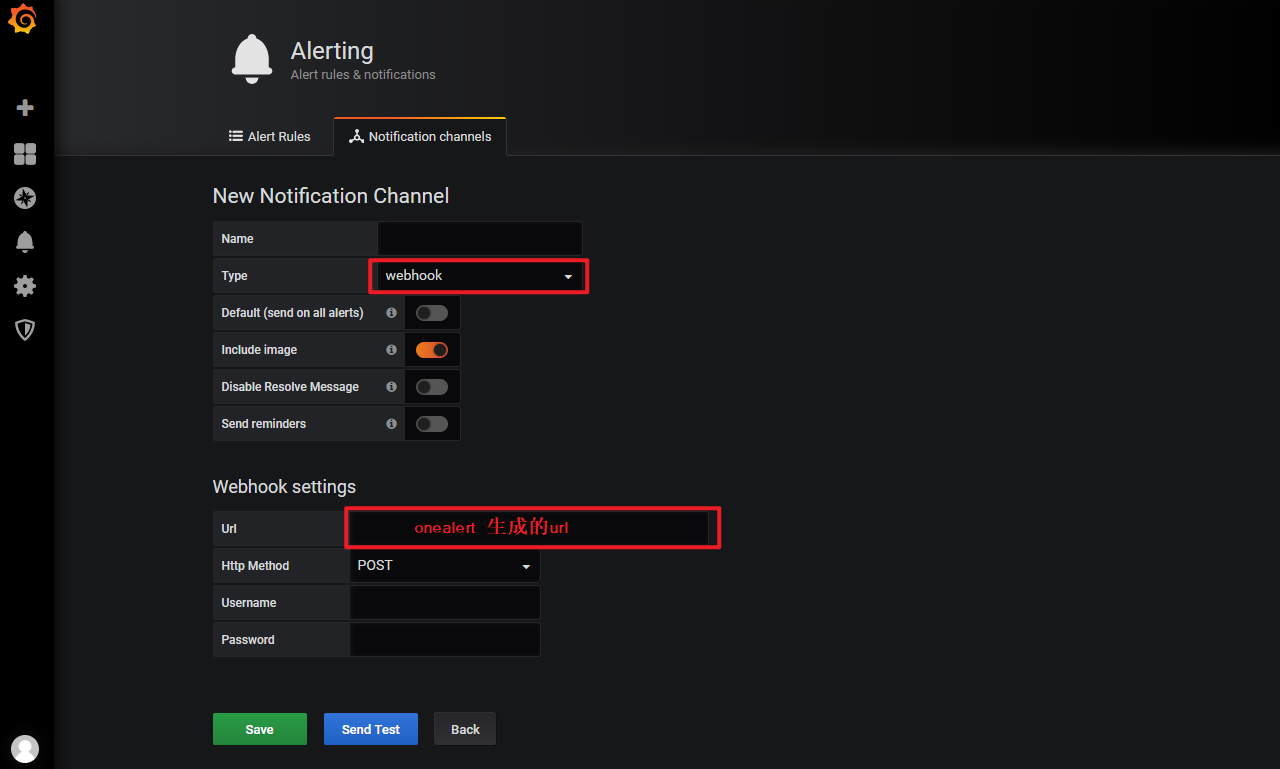
第四步:接入Onealert
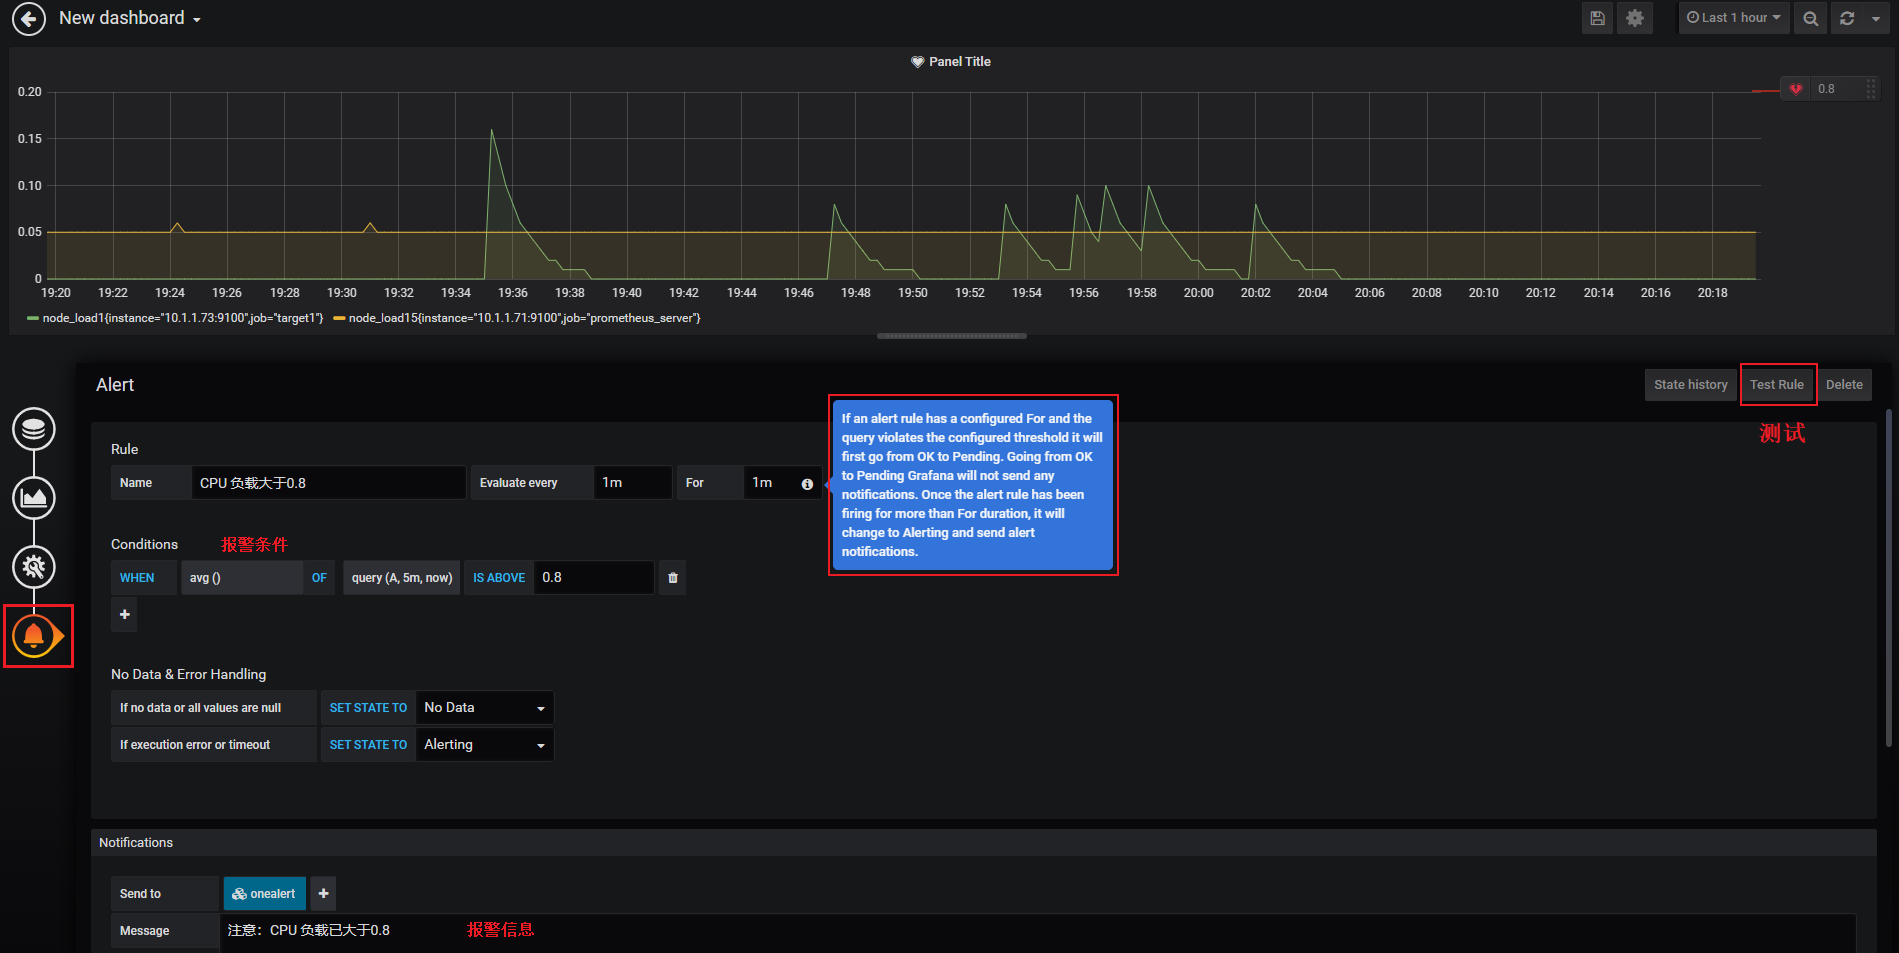
5.添加报警
添加报警时可以在Send to选择接入的第三方平台
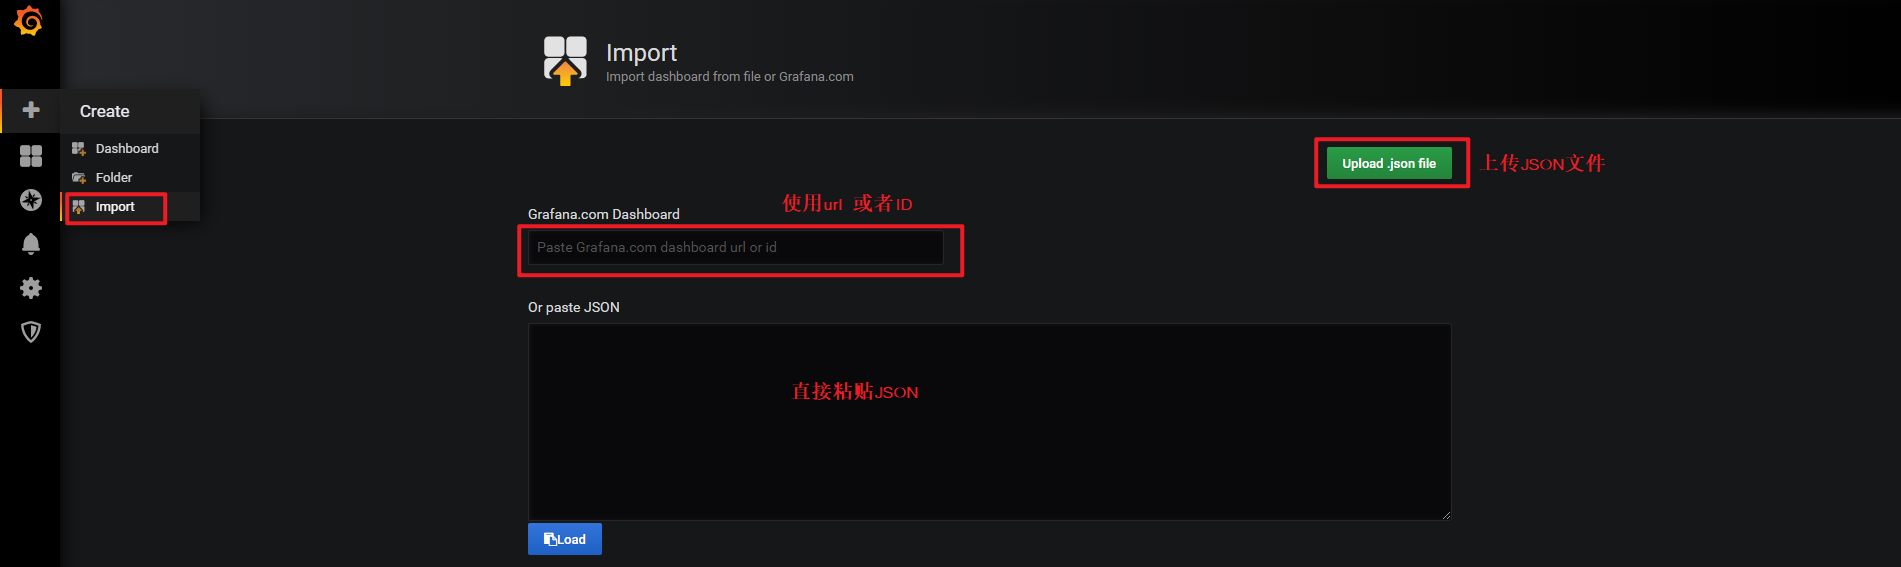
6.导入Dashboard
官方社区: https://grafana.com/grafana/dashboards
可参考开源Dashboard: https://github.com/percona/grafana-dashboards
测试添加: https://grafana.com/grafana/dashboards/8919
直接输入ID 8919
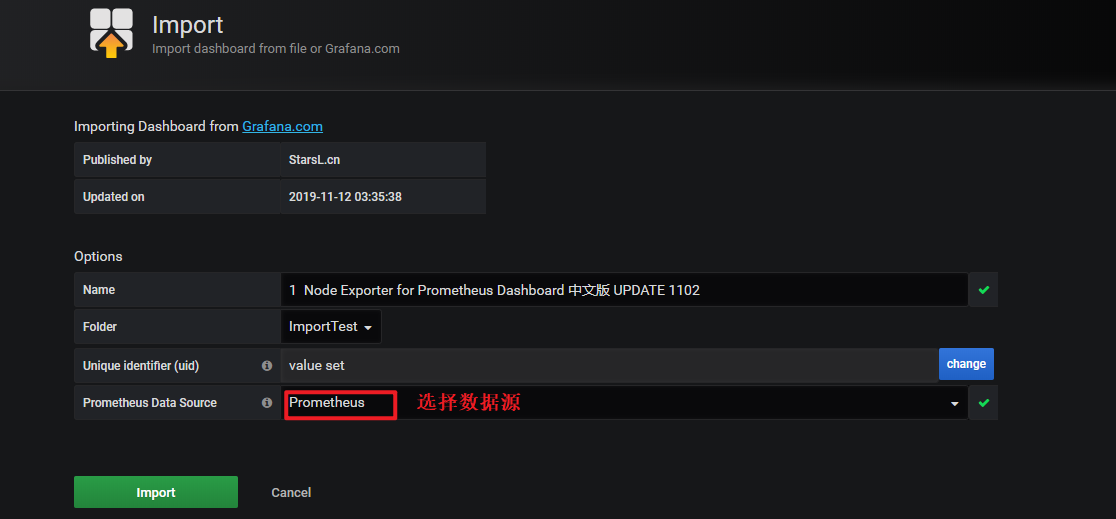
效果
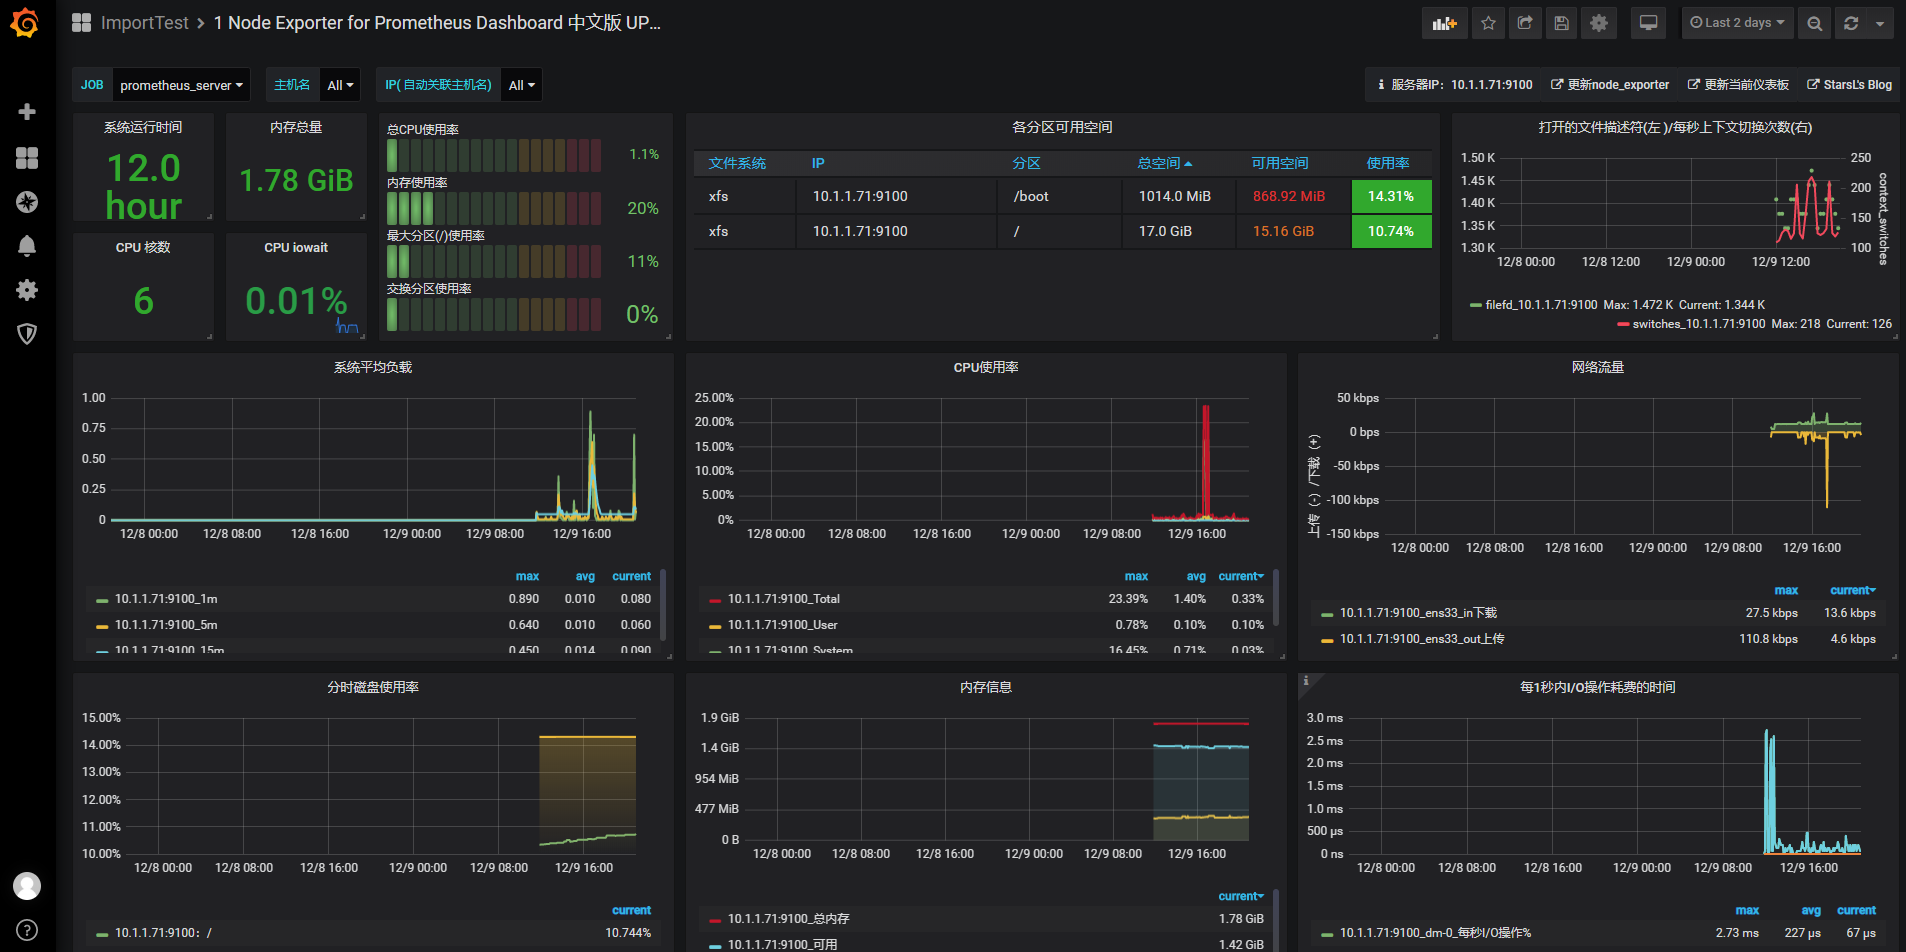
其他
压力测试
cat /dev/urandom | md5sum